
In part 4 of the series we are exploring Metrics.
Kubernetes can collect metrics of attributes like CPU or Memory etc. These metrics are collected by a Metrics Server, you can use the built in Kubernetes one (Metrics Server), or you can use external metrics which are collected by something else, e.g. Prometheus and then exposed into Kubernetes for it to act upon.
What should you use?
- CPU or memory-based scaling: Metrics Server is sufficient.
- Web applications: Prometheus + Prometheus Adapter is a common choice, allowing you to scale on application-level metrics such as request rate or latency.
- Event-driven workloads (queues, streams, messaging): KEDA is often the easiest and most feature-rich solution because it integrates directly with many external systems and supports scaling from zero.
Install Metrics
Before we can access metrics about the Pods (workloads) running, we need to enable the Metrics Server within our Kubernetes cluster.
Within the Kubespray Ansible role, this can be done with updating the group vars within the file:
inventory/[mycluster]/group_vars/k8s_cluster/addons.ymlChange the line from false to true:
metrics_server_enabled: trueThere are other options, but we’re not touching them for now.
And then we reapply the Ansible to enable this feature:
cd ~/kubespray
source .venv/bin/activate
ansible-playbook -i inventory/k8scluster1/inventory.ini cluster.yml -K -b -v --private-key=~/.ssh/id_ed25519
Entering the BECOME password (i.e. sudo), as you run it.
Assuming the Ansible run works okay then you’re all set.
How check it is enabled?
To verify if it is working, by far the easiest way, is give it say 2-3 minutes after enabling to allow it to generate some metrics and then run the following:
kubectl top nodes
kubectl top pods -A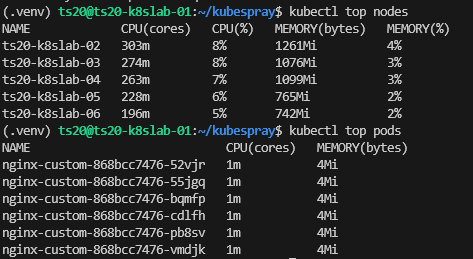
As you can see we have metrics being shown therefore it would appear to be logging these metrics as expected.
To check the logs of the Metrics Server, you can use something like:
kubectl logs -n kube-system deployment/metrics-serverExample Using Metrics
So now let’s try and example which will make use of the metrics we are getting from the Metrics-Server which collects these metrics from the pods themselves.
We’ll create and apply the following Kubernetes YAML files: nginx-custom-hpa.yaml (top) and nginx-custom.yaml (bottom). The first file is the Horizontal Pod Autoscaler (HPA), this defines how Kubernetes will detail with the Pods via the Deployment to scale up and scale down based on the thresholds we specify.
apiVersion: autoscaling/v2
kind: HorizontalPodAutoscaler
metadata:
  name: nginx-custom
spec:
  scaleTargetRef:
    apiVersion: apps/v1
    kind: Deployment
    name: nginx-custom
  minReplicas: 1
  maxReplicas: 10
  metrics:
    - type: Resource
      resource:
        name: cpu
        target:
          type: Utilization
          averageUtilization: 25
  behavior:
    scaleUp:
      policies:
        - type: Percent
          value: 50
          periodSeconds: 60
    scaleDown:
      stabilizationWindowSeconds: 60
      policies:
        - type: Percent
          value: 50
          periodSeconds: 60
# Deployment Definition
apiVersion: apps/v1
kind: Deployment
metadata:
name: nginx-custom
labels:
app: nginx-custom
spec:
replicas: 1
selector:
matchLabels:
app: nginx-custom
template:
metadata:
labels:
app: nginx-custom
spec:
containers:
- name: nginx-custom
image: geekmungus/nginx-custom:v1.0.0
ports:
- containerPort: 80
resources:
requests:
cpu: 256m
memory: 128Mi
limits:
cpu: 512m
memory: 256Mi
---
# Service Definition
apiVersion: v1
kind: Service
metadata:
name: nginx-custom-service
labels:
app: nginx-custom
spec:
type: LoadBalancer
selector:
app: nginx-custom
ports:
- port: 80
targetPort: 80Now we apply the above:
kubectl apply -f nginx-custom-hpa.yaml -f nginx-custom.yamlAfter a few minutes just make make sure the metrics are being captured correctly. If where it says 0% in the above it is saying <unknown> its either you need to wait a few minutes for the metrics to be collected, you have no actual metrics, or there is a problem with the pod/metric-server so the values are not appearing as expected.
kubectl describe hpa nginx-custom
kubectl top pods
kubectl get hpa
We can see here that it is showing 0% which is good, that means its collecting the percentage CPU from the Deployment. Before we attempt to stress the Nginx application we’ve deployed, let’s dig into what these thresholds actually mean and how they work.
Explanation
Within the HPA configuration there are two main parts to consider metrics and behaviour:
- metrics answers: When should I scale?
- behaviour answers: How quickly am I allowed to scale?
Metrics – When should I scale?
The HPA configuration says:
metrics:
  - type: Resource
    resource:
      name: cpu
      target:
        type: Utilization
        averageUtilization: 25
This tells the HPA controller to: “Try to keep the average CPU utilisation across all Pods at 25% of their requested CPU.” Notice this is not the Kubernetes node CPU!
So how does it work out what percentage of pod CPU usage is so it can be averaged. You’ll notice that we specify the “requests” on the pod definition.
...
resources:
  requests:
    cpu: 100m
...
Based on the above it means:
- 25m CPU used = 25%
- 50m CPU used = 50%
- 100m CPU used = 100%
So a worked example is:
| Replicas | CPU usage | Average Utilisation | Desired |
|---|---|---|---|
| 1 | 20m | 20% | Do nothing |
| 1 | 40m | 40% | Scale up |
| 2 | 15m + 20m | 17.5% | Scale down |
How HPA Calculates the Replicas
HPA uses a simple rough calculation as follows to work out if it should scale:
desiredReplicas = currentReplicas × (currentUtilisation / targetUtilisation)So if we put in some actual figures to that:
Current replicas = 2
Current CPU = 60%
Target = 25%
Then within the calculation we end up with:
2 × (60 / 25) ≈ 4.8So rounding up that’s 5 replicas required. It is just the desired number of replicas, it doesn’t decide how quickly it gets to that figure, that’s the next section.
Behaviour – How quickly am I allowed to scale?
So within the configuration we had the “behaviour” section, this decides how quickly it scales up. In effect it says if the calculation above says you need 5 replicas, but you are at 2 replicas. You can only increase by 50% every 60 seconds.
  behavior:
    scaleUp:
      policies:
        - type: Percent
          value: 50
          periodSeconds: 60
    scaleDown:
      stabilizationWindowSeconds: 60
      policies:
        - type: Percent
          value: 50
          periodSeconds: 60
So in practice this means that if you had 2 replicas, but needed 5, it would first do the calculation
50% of 2 = 1So Kubernetes would add another replica to get to 3. Then it waits 60 seconds, and re-evaluates, does a high CPU condition still exist, i.e. one above the average utilisation target of 25%, if yes, it scales up based upon:
50% of 3 = 1.5So it adds another, so its now at 4 replicas, waits 60 seconds and tries again and so on.
So why? Its to avoid “thrashing” for a workload that is spiking up and down. You don’t want it to immediately scale, because if the high CPU condition is short lived it will immediately add pods only to take them away again.
The same of course is true of the scaling down, you don’t want a brief drop in CPU workload to suddenly trigger a removal of replicas; especially if replicas have some form of startup time – if they were to need to be brought back quickly.
Generate CPU Load
Let’s try to make it generate some CPU load, below is a script (load-gen.sh) which can be run to generate some load and force a scale up.
#!/usr/bin/env bash

# ./traffic-gen.sh www.google.com 2

#set -euo pipefail

if [ "$#" -lt 1 ]; then
    echo "Usage: $0 <url> <concurrency> <duration-in-seconds>"
    exit 1
fi

URL=$1 # Extract the position argument 1
CONCURRENCY="${2:-50}" # Extract the position argument 2, if not present use default.
DURATION_SECONDS="${3:-300}" # Extract the position argument 3, if not present use default.

echo "Generating load against: $URL"
echo "Concurrency: $CONCURRENCY"
echo "Duration: ${DURATION_SECONDS}s"
echo

end_time=$((SECONDS + DURATION_SECONDS))

worker() {
  while [ "$SECONDS" -lt "$end_time" ]; do
    curl -s -o /dev/null "$URL" || true
  done
}

for i in $(seq 1 "$CONCURRENCY"); do
  worker &
done

while [ "$SECONDS" -lt "$end_time" ]; do
  echo "Load Generator Running... $(date)"
  sleep 10
done

wait
echo "Load test complete."
Run it with the below, swapping the IP address of your application’s service IP (Load Balancer).
./load-gen.sh http://192.168.101.160 1000 120This will generate 1000 worker threads which will attempt to load the application.
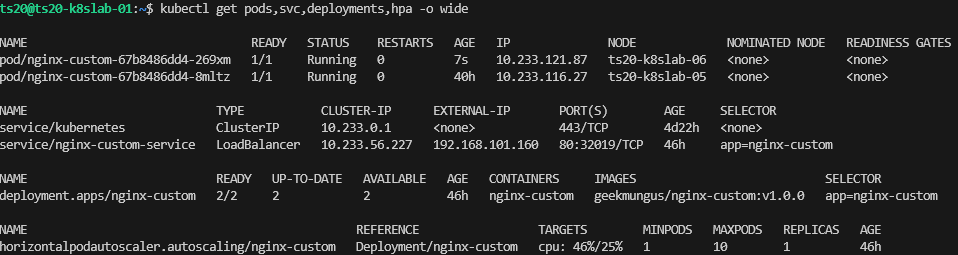
We can see the load is going up, 46% now, where the target is 25%
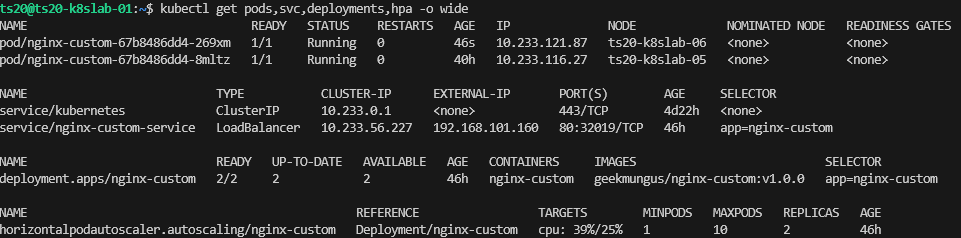
After a few minutes, we then see its added another replica, lovely, that is just what we wanted to see. When the script finishes, the load is reduced and it will scale back down again.
Conclusion
So in this article, we have explored Horizontal Pod Autoscaler (HPA), although a simple example it does show how Kubernetes can manage the performance and resilience of an application automatically by watching metrics and acting accordingly. We’ll explore this topic a bit more in a later article where you have an application that uses queues, and therefore this method may not act as required in the event of increased CPU workload.
Essentially:
- The metrics section defines the goal (e.g. “keep average CPU at 25%”).
- The HPA controller continuously calculates the desired number of replicas to achieve that goal.
- The behavior section defines the rate limits for scaling up or down, preventing sudden jumps that could destabilize your application or infrastructure.
This separation between what state the cluster should reach and how quickly it’s allowed to get there is what makes HPA both responsive and stable.
Additional Information
https://www.vcluster.com/blog/how-to-set-up-metrics-server-an-easy-tutorial-for-k8s-users
https://blog.devgenius.io/kubernetes-deployment-using-kubespray-63e5086237f7
https://daegonk.medium.com/kubernetes-metrics-server-c3fb49925aa5