We recently deployed some hardware Kemp ECS Connection Managers (which are designed to front the Dell ECS storage platform), however we were a bit dismayed to see there was no way to monitor the hardware status via GUI, SNMP or the Rest API.
We had this issue raised after we had a PSU failure occur after the units had been deployed after a few weeks running, it just so happened that someone was in the data centre and spotted the issue, we had no email alert, no warning in the GUI that one of the PSU had failed.
At the time of writing Kemp have no way to do this via “their” means, however it appears possible if you request it (of Kemp) to get yourself IPMI (BMC) access to the units, where you can obtain a view of this information. In our case we wanted something where we could easily automate a check via our monitoring platform NagiosXI. After some digging we found that the OIDs for the PSUs (and other hardware components) are available via SNMP, but just not presented in the Kemp Load Master MIB.
The details below might be of help, in our case we monitor the fan speed and voltage of each PSU via SNMP, our NagiosXI checks look for a value of at least 10volts and 2000 RPM, if these drop below that value; like they would if a failure was to occur we get notified.
Of course we are inferring a fault here by the values, doesn’t guarantee it has failed.
The SNMP needs to be configured from under Logging Options → SNMP Options, you should add the “SNMP Clients” as the NagiosXI server IP addresses to restrict the surface area for comprimise.
However it is missing any of the hardware SNMP OID to obtain system hardware information. But it appears you can get some basic information from the underlying OS via the SNMP entityMIB.

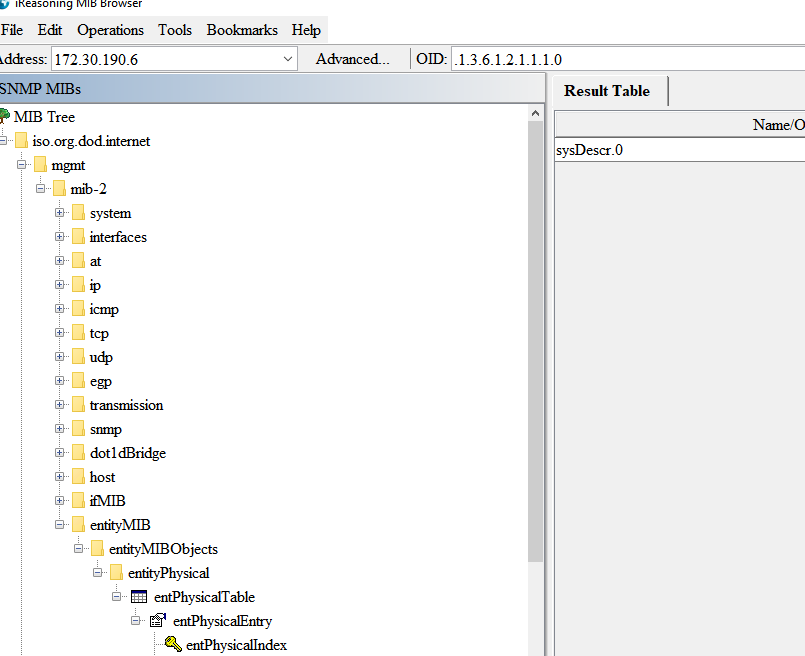
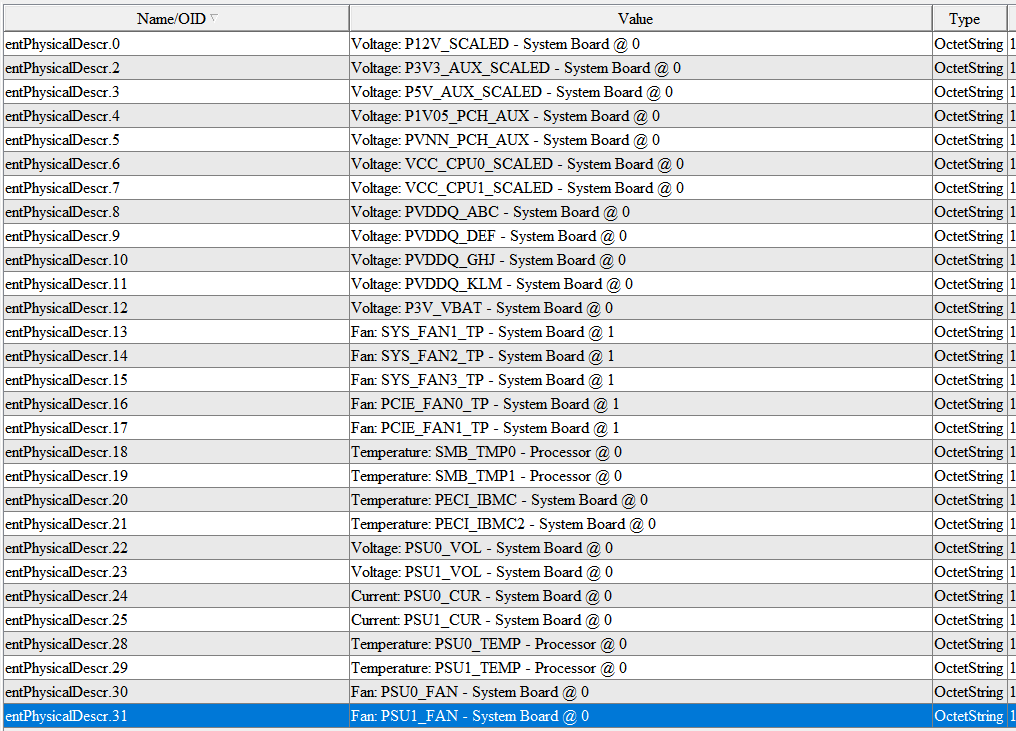
There is this block/subtree of OIDs: .1.3.6.1.2.1.47.1.1.1.1.2.0 (entPhysicalDescr), where the .0 at the end is each physical endpoint going from 0 to 31 that gives the names of each of the physical entities, in this case CPU fans, systems fans, PSU voltages etc.

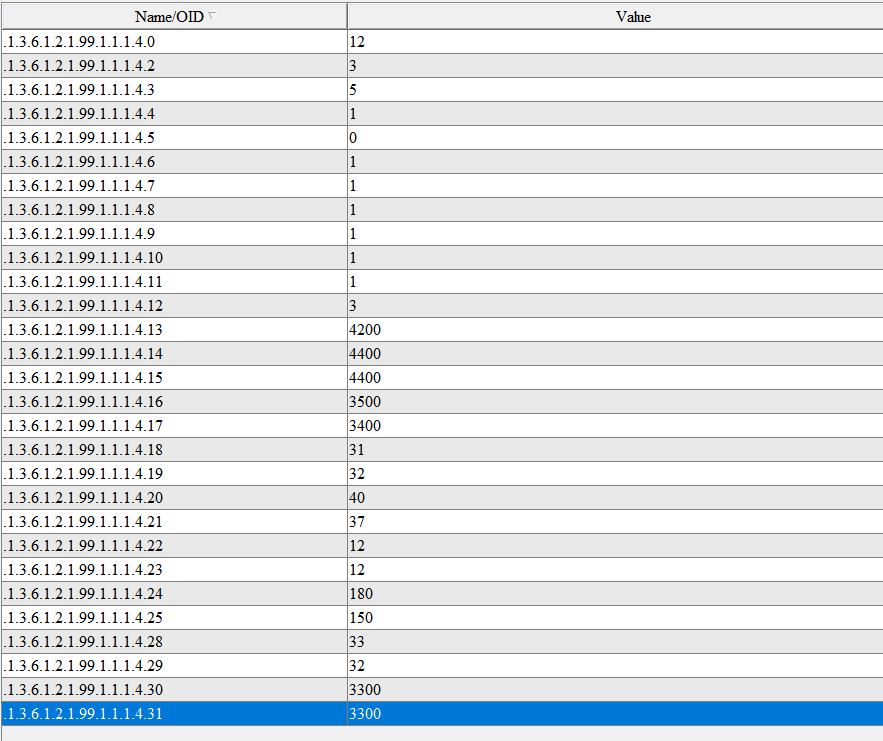
Then there is a block/subtree of OIDs: .1.3.6.1.2.1.99.1.1.1.4.0, were the value matches up with the ID of the description going from 0 to 31.

For example, “.22” is: “Voltage: PSU1_VOL – System Board @ 0” so gives the PSU voltage, which in this case has a value of “12” volts.
It is assumed that if this reads 0 or null, then the PSU is faulty, based on this we have some information we can use to verify the hardware status of some of the Kemp Load Master physical components even though we don’t actually have anything that Kemp officially say you can use.
Some example NagiosXI checks would be as below, where we have multiple entities you can put them on one command and filter accordingly.
For example two PSU, we can chain them together give labels and also use the “-s” to specify an expected result, in this case in normal operation the PSU voltage should be 12 volts, so if either of the OIDs report anything other than 12, we assume a failure and mark it as CRITICAL.
./check_snmp -H 1.2.3.4 -C community -P 2c -o .1.3.6.1.2.1.99.1.1.1.4.22 -t 5 -s 12 -l "PSU 0:" -u "v" -o .1.3.6.1.2.1.99.1.1.1.4.23 -t 5 -s 12 -l "PSU 1:" -u "v"The PSU Fan speed in this case we assume the fans should be spinning at at least 3000 RPM, if they are less than that Warning, if less than 2000 then Critical, which would imply a fault.
./check_snmp -H 1.2.3.4 -C community -P 2c -o .1.3.6.1.2.1.99.1.1.1.4.30 -t 5 -w3000: -c2000: -l "PSU 0:" -u "RPM" -o .1.3.6.1.2.1.99.1.1.1.4.31 -l "PSU 1:" -w3000: -c2000: -u "RPM"The PSU temperature speed in this case we assume the fans should be spinning at at least 3000 RPM, if they are less than that Warning, if less than 2000 then Critical, which would imply a fault.
Hey Tristan, I hope you’re well! Aoife from Kemp here. I just wanted to say that I loved reading your recent post and thanks for using Kemp. Please feel free to reach out if you ever need anything! Many thanks, Aoife